published on
 Movement 2: Maximum Change in Carbon Emissions, RCP 2.6
Recorded at the opening concert of Visiones Sonoras Festival, Teatro Ocampo, Morelia, Mexico. 11 October 2017. Abel Romero & Pedro Andrés Rodríguez, violins; Judith Reyes, viola; Edgardo Espinosa, cello; Neil Rolnick, computer.
Oceans Eat Cities can be thought of as a musical sonification of data which projects the likely impact rising sea levels will have on cities globally. It is also a musical statement of why we need to address climate change now.
The research organization Climate Central, of Princeton, NJ, supplied me with the data used in the composition of the piece. The data details how rising sea levels will inundate individual cities. It considers various possible scenarios based on the degree to which we mitigate the release of carbon emissions in the atmosphere. For each city, under each scenario, there is data which shows the percentage of the population which will be displaced. I have used the two most extreme scenarios.
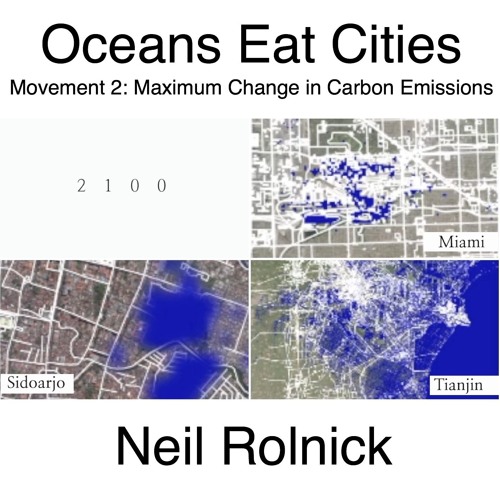
The first movement uses data from the scenario in which carbon emissions continue as they are now. The second movement uses data from the scenario in which we are successful in cutting most carbon emissions, beginning right now. The first movement uses data from Shanghai (China), Mumbai (India), Bangkok (Thailand), and Osaka (Japan). The second movement uses data from Miami (USA), Sidoarjo (Indonesia), and Tianjin (China).
The basic data mapping of the piece is very simple: After an initial statement of a one-minute musical idea, the idea is repeated with slight variations in instrumentation. In each movement, I’ve mapped the approximately 8 minute time span to reflect the years of 2015 to 2100, as in the data supplied by Climate Central. The data describes the percentage of the 2015 population which will be impacted by sea level rise in a particular carbon emission scenario. I reflect this in the composition by subtracting that percentage of the notes from the music. The data changes every 5 years, and that time frame is reflected with a musical change every 20 seconds or so. The years from which data is taken are marked in the score as boxed text. As you might expect, the first movement nearly disappears, since it reflects the scenario of “business as usual” in terms of carbon emissions. The second movement changes, but not nearly as drastically.
The piece can be accompanied by a video track, created by R. Luke DuBois, which shows street maps of the cities whose data is being used in each movement, and the year. As the score moves through the years of the 21st century, each map is overlaid with blue, representing the encroachment of the ocean as projected in Climate Central’s data.
A second level of data mapping involves the processing of the acoustic sounds of the quartet, and it is more or less the inverse of the process described above. Using the same data sets as are used to subtract notes from the musical materials, the volume of the processing is increased to reflect the percentage of population in the city which will be displaced by the rising sea level. The processing covers portions of the music, just as the ocean will cover portions of the cities.
Movement 2: Maximum Change in Carbon Emissions, RCP 2.6
Recorded at the opening concert of Visiones Sonoras Festival, Teatro Ocampo, Morelia, Mexico. 11 October 2017. Abel Romero & Pedro Andrés Rodríguez, violins; Judith Reyes, viola; Edgardo Espinosa, cello; Neil Rolnick, computer.
Oceans Eat Cities can be thought of as a musical sonification of data which projects the likely impact rising sea levels will have on cities globally. It is also a musical statement of why we need to address climate change now.
The research organization Climate Central, of Princeton, NJ, supplied me with the data used in the composition of the piece. The data details how rising sea levels will inundate individual cities. It considers various possible scenarios based on the degree to which we mitigate the release of carbon emissions in the atmosphere. For each city, under each scenario, there is data which shows the percentage of the population which will be displaced. I have used the two most extreme scenarios.
The first movement uses data from the scenario in which carbon emissions continue as they are now. The second movement uses data from the scenario in which we are successful in cutting most carbon emissions, beginning right now. The first movement uses data from Shanghai (China), Mumbai (India), Bangkok (Thailand), and Osaka (Japan). The second movement uses data from Miami (USA), Sidoarjo (Indonesia), and Tianjin (China).
The basic data mapping of the piece is very simple: After an initial statement of a one-minute musical idea, the idea is repeated with slight variations in instrumentation. In each movement, I’ve mapped the approximately 8 minute time span to reflect the years of 2015 to 2100, as in the data supplied by Climate Central. The data describes the percentage of the 2015 population which will be impacted by sea level rise in a particular carbon emission scenario. I reflect this in the composition by subtracting that percentage of the notes from the music. The data changes every 5 years, and that time frame is reflected with a musical change every 20 seconds or so. The years from which data is taken are marked in the score as boxed text. As you might expect, the first movement nearly disappears, since it reflects the scenario of “business as usual” in terms of carbon emissions. The second movement changes, but not nearly as drastically.
The piece can be accompanied by a video track, created by R. Luke DuBois, which shows street maps of the cities whose data is being used in each movement, and the year. As the score moves through the years of the 21st century, each map is overlaid with blue, representing the encroachment of the ocean as projected in Climate Central’s data.
A second level of data mapping involves the processing of the acoustic sounds of the quartet, and it is more or less the inverse of the process described above. Using the same data sets as are used to subtract notes from the musical materials, the volume of the processing is increased to reflect the percentage of population in the city which will be displaced by the rising sea level. The processing covers portions of the music, just as the ocean will cover portions of the cities.
- Genre
- Contemporary Classical