published on
 # 79 Listening to the Earth Sing by Chris Hayward
Southern Methodist University, Dpt of Geology, Dallas TX
Presented at ICAD 1992
Published in:
Auditory Display, Audification, and Auditory Interfaces by Gregory Kramer. 1994
pages 369-405
NOTES:
Unlike many other kinds of data, seismograms may be successfully audited with a minimum of processing. The technique works so well because both sound and air and seismic waves in rock follow the same basic physics, that described by the Elastic Wave Equation.
Problems in edifying seismograms arise when the subsonic wide dynamic range signals must be rescaled to the audio without introducing distracting artefacts.
The use of audio for seismic quality control, analysis, and interpretation will develop only when audio displays become integrated into the daily tools of seismologists.
1. INTRODUCTION
Seismic data… is an almost perfect case for audification. Seismic data sets are large - seldom less than a few thousand samples and as much as several billion samples. A simple audification will play from several seconds to more than an hour. It will sound like a recording of natural environmental sounds because sounds transmitted through air (acoustic waves) have similar physics to seismic vibrations transmitted through the earth (elastic waves).
2. BACKGROUND
2.1 Comparison of Sound with Seismic Waves
Most seismic interpretation assumes that the recorded seismograms are elastic waves (1) and, therefore, follow the wave equation (2):
WAVE EQUATION (http://en.wikipedia.org/wiki/Wave_equation)
This same equation describes the transmission of sound through air. For sound in air c is about 1,100 feet/second. In rock, there are several different kinds of waves that propagate out from the source at different velocities. The fastest compression-rarefractions, or P-waves, travel at 5,000 feet/second in rocks near the surface, and over 40,000 feet/second deep in the earth's mantle. Slower shear wave distortions or S-waves travel at about half the P-wave speed. For sensors and sources near the earth's surface, there are also Rayleigh and Love surface waves that travel at lower speeds.
Seismic waves have dominant frequencies of 40Hz, much lower than audible sound.
(1) This is not true in special cases very near the source where the explosion, impact, or earthquake permanently deform or fracture the rock.
(2) For a more general discussion to the elastic equations of motion as used in seismology see Aki and Richards
[Aki, K., and P.G. Richards. Quantitative Seismology: Theory and Methods. W.H. Freeman, 1980]
2.2 THE GOALS OF SEISMOLOGY
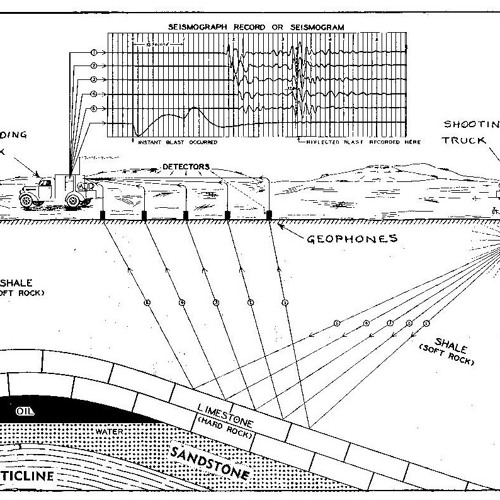
EXPLORATION SEISMOLOGY. Exploration seismology uses a controlled source such as a hammer or small explosive charge, and records reflections and refractions from the rock layers a few feet to several miles below the surface. (Signals recorded for exploration seismology are short and have a limited dynamic range and bandwidth compared to most sounds. They are more like a recording of a hand clap or gunshot made in a canyon… the source impulse is short and the interesting portion of the recording is the echo.)
PLANETARY SEISMOLOGY. Planetary seismology uses recordings of volcanic eruptions, large explosions, and earthquakes. (Signals recorded for planetary seismology are continuous)
4.3 FREE OSCILLATION DATA
One interesting application of audio data is for free oscillation data. The earth rings when struck, like any solid object such as a bell. The characteristics of the oscillations depend on where and how the earthquake occurred, the material properties of the surrounding rock, and the location of the seismic recorder. It is not yet clear what could be illustrated in an audio display but, in view of the analogs to bell like objects, the possibilities are intriguing.
4.4 DATA DISCOVERY
Data discovery includes the processes of examining seismic waveforms for information of interest and forming the initial hypothesis about the causes of the disturbances. Such hypothesis will be tested and explored further with additional specialised processing and displays. This initial look forms the jumping-off point for imaginative new observations and ideas. By enriching the current displays with audio in a simple direct manner with few processing biases, there is less possibility that interesting information will be overlooked.
…Auditory displays summarise the information in a different manner than common plots, allowing a second chance to recognise relationships in the seismic data.
4.7 EDUCATION
Education is potentially a very rewarding application. The explanation of how seismic energy travels through the earth can be enhanced with examples and explanations that draw on everyday listening experience, such as echoes or the sounds that objects make when hit. The intuitive grasp of physical acoustics that we accumulate in our life can be carried over to certain aspects of seismology.
4.8. MODEL WATCHING
Much of seismology is devoted to determining reasonable earth structures. Once an initial hypothesis is formed, numerical models are developed to test and further improve the hypothesis. Various methods of 'fitting' data to models are available, but it is often appropriate to build a guided model based on interactive input. The model is iterated and displayed versus the real data while the user makes certain adjustments to model parameters. Model and real data may be summarised with a goodness of fit, but may also be displayed overlaid. It is natural in such a case to also display the audification in side-by-side comparisons.
5. PROBLEMS IN AUDIFYING SEISMOGRAMS
Ideally, processing techniques should preserve the physics of the input data while making all interesting features audible. This is required if the final display is to take advantage of our native ability and experience in interpreting natural sound. To be audible the sound must fit within human frequency and amplitudes limits for comfortable listening.
* The information is nearly subsonic
Some recorded data includes audio frequencies, but the dominant energy for most reflections is centred near 30 Hz where it is difficult to distinguish small changes in pitch and timbre.
* The bandwidth is narrow compared to natural sounds.
Seismologists go to great lengths to record broadband signals. Good definition over three octaves is considered excellent. This is far short of the ten-octave range of natural sounds.
* Both the direct wave and reflected signals are short compared to natural speech and most environmental sounds. Most reflection recording is less than 3 seconds with much of the interest in the first second or two.
* Classical seismic interpretation (where each waveform peak is interpreted) is nearly impossible in a straight edification. In reflection seismic interpretation, coherent peaks on adjacent traces are interpreted as reflections of a rock layer. The times of these peaks and the interval to the next set of peaks are careful measured and mapped. This measurement of each wiggle may be more amenable to signification or visual display.
* The dynamic range of some signals is extremely large (>100dB) over a relatively short period. This problem has to be handled by graphical dispelys too. One method used for plots is to clip waveforms when they exceed a particular amplitude.
* The signals are nearly all far infrasonic. Typical teleseisms (distant signals) have their dominant energy below 1 Hz and only the closest earthquakes and blasts have energy above 10Hz.
* Earthquake signals span more than 17 octaves. This presents problems not only for auditory displays, but for almost any other form of raw data display. Researchers have found it difficult to record or deal with displays that include more than a few octaves of signal.
* The dataset size can be huge. Because stations record continuously for years, the dataset size grows. If instrumentation has not changed, selected waveforms from many years of recording may be appropriate to a particular interpretation problem. Indexing, retrieving, and displaying these selected segments is a problem in itself.
* The dynamic range of interesting earthquake signals is large.
Today, 24-bit recording systems with a dynamic range > 140 dB are common. Fortunately, in many cases 16 bits will adequately represent the waveform.
6. PROCESSING TECHNIQUES
6.1 PREPROCESSING
Preprocessing consists of adapting the raw seismic field data into a form that can be output to an audio interface. Most dat requires a simple amplitude rescaling and DC removal to adjust the range of the recorded data to the range of the output D-to-A converters. Usually high-quality interpolation is also needed to produce an acceptable sample rate without distorting the input waveform.
DC bias
http://en.wikipedia.org/wiki/DC_bias (mean value of the waveform)
Interpolation
http://en.wikipedia.org/wiki/Interpolation
6.2 TIME-COMPRESSION
Some shallow exploration reflection data has enough high frequency to be audible if played at recorded speed. Most earthquake records are not directly audible since the significant energy is all below 10 Hz. To be heard the seismograms must be processed to move the dominant energy into the audible bands. This process must preserve any of the relations to acoustic physics. For example, a low pianolike sound must remain pianolike when shifted in frequency. It must preserve the characteristic attack and decay of impulsive sounds as well as harmonic relationships. Two tones separated by an octave must maintain an octave separation shifted up in frequency.
Time-compression is playing data faster than it was recorded. It is a simple direct method of making low frequencies audible and it preserves the physics (the result still follows the wave equation). A data stream recorded at 40 samples/second and played at 8000 samples/second has a 200-times compression. This allows 3 hours of recording to be played back in less than a minute, comparable to the amount of time to quickly study 3 hours of plotted data.
6.3 AUTOMATIC GAIN CONTROL (AGC)
Some type of amplitude scaling has to be done to bring the signals in the range of the D-to-A. Many seismic signals have a dynamic range in excess of comfortable listening levels, so signals may be processed through an AGC prior to playback. AGC increases the volume during quiet periods and decreases it for large signals analogus to automatic level controls on recording equipment.
Window lengths are typically 200 samples or about 1/40 second for most traces.
It was also necessary to preprocess traces with AGC before doing frequency doubling.
Automatic Gain Control
http://en.wikipedia.org/wiki/Automatic_gain_control
6.4 FREQUENCY DOUBLING
While time-compressing data does move events from the subaudible to the audible, it brings with it another set of problems. Signals from some earthquakes may only last a minute on the original recording. Speeding up the recording by 200 times will result in a sound that only lasts a fraction of a second, so short that it is difficult to study. It may be recognisable as a single sound but it cannot be taken apart into its components.
Some early experimenters avoided the problem by using the minimum compression to make the seismogram audible. The resultant sounds were dominated by very low frequencies. Others shifted the frequencies into the audio range by multiplying the signal by a carrier to produce an FM signal. Unfortunately, this is an additive shift in frequencies. Thus, if 20 Hz is shifted to 440 Hz, then 40 Hz will be shifted to 480 Hz. This does not preserve the harmonic relationships. It also produces a section that is narrower bandwidth than the original (in terms of octaves) and a sound that is quickly fatiguing.
Close study requires a way to slow the playback without changing the pitch and the harmonic relationships. The operation of frequency doubling shifts any pure tone up one octave. The audio track may then be played at half speed to get the original pitch in a signal with twice the duration.
One problem with frequency doubling is that it accentuates the dominant energy and suppresses more subtle arrivals. Informal experiments indicated that it improves the display if digital automatic gain control is applied prior to frequency doubling.
Frequency Modulation
http://en.wikipedia.org/wiki/Frequency_modulation
6.5 ANNOTATION AND MARKERS
Undamped bell tones were used in the initial experiments. They were replaced with dreamlike sounds generated by passing an impulse through a narrow bandwidth, first order Butterworth filter.
Butterworth Filter
http://en.wikipedia.org/wiki/Butterworth_filter
6.6 LOOPING
For some recordings, using an equaliser to boost or cut different frequency ranges while the loop is playing will help extract particular sounds.
8. CONCLUSIONS
Annotation is particularly important. Good annotation allows the listener to match events on a graphic display with a correlated audio. In multiple annotations, tones must be separated from each other by slight frequency differences or positions in stereo. Annotation tones must be similar to the signal or the listener will perceive two unrelated streams and it will be difficult to relate the timing between the two.
9. FUTURE EXPERIMENTS
The use of audio suggests new possibilities for seismic attribute displays in exploration data, including direct hydrocarbon indicator displays of various types, audio attribute displays, and amplitude vs. offset displays. Of particular interest are displays for modelling and quick look, when the audio tag may indicate whether the visual display is useful.
The audio seismogram is still in its infancy. The tools to produce it are currently cumbersome and not part of the daily tool set available to seismic analysts. The real proof of the utility of the tool will come only when auditory display is a natural part of seismic analysis. This will require making audio tools accessible to working seismologists in a natural well-designed interface.
NOTABLE REFERENCES
1. Aki, K., and P.G. Richards. Quantitative Seismology: Theory and Methods. W.H. Freeman, 1980.
3. Bullen, K. E., and Bruce A. Bolt. An Introduction to the Theory of Seismology, 4th ed. Cambridge: Press Syndicate of the University of Cambridge, 1985.
5. Frantti, G. E., and L. A. Leverault. "Auditory Discrimination of Seismic Signals from Earthquakes and Explosions." Bull. Seismol. Soc Am. 55(1) (1965): 1-26.
8. Speeth, Sheridan Dauster. "Seismonitor Sounds." J. Acous. Soc. Am. 33(7) (1961): 909-916.
# 79 Listening to the Earth Sing by Chris Hayward
Southern Methodist University, Dpt of Geology, Dallas TX
Presented at ICAD 1992
Published in:
Auditory Display, Audification, and Auditory Interfaces by Gregory Kramer. 1994
pages 369-405
NOTES:
Unlike many other kinds of data, seismograms may be successfully audited with a minimum of processing. The technique works so well because both sound and air and seismic waves in rock follow the same basic physics, that described by the Elastic Wave Equation.
Problems in edifying seismograms arise when the subsonic wide dynamic range signals must be rescaled to the audio without introducing distracting artefacts.
The use of audio for seismic quality control, analysis, and interpretation will develop only when audio displays become integrated into the daily tools of seismologists.
1. INTRODUCTION
Seismic data… is an almost perfect case for audification. Seismic data sets are large - seldom less than a few thousand samples and as much as several billion samples. A simple audification will play from several seconds to more than an hour. It will sound like a recording of natural environmental sounds because sounds transmitted through air (acoustic waves) have similar physics to seismic vibrations transmitted through the earth (elastic waves).
2. BACKGROUND
2.1 Comparison of Sound with Seismic Waves
Most seismic interpretation assumes that the recorded seismograms are elastic waves (1) and, therefore, follow the wave equation (2):
WAVE EQUATION (http://en.wikipedia.org/wiki/Wave_equation)
This same equation describes the transmission of sound through air. For sound in air c is about 1,100 feet/second. In rock, there are several different kinds of waves that propagate out from the source at different velocities. The fastest compression-rarefractions, or P-waves, travel at 5,000 feet/second in rocks near the surface, and over 40,000 feet/second deep in the earth's mantle. Slower shear wave distortions or S-waves travel at about half the P-wave speed. For sensors and sources near the earth's surface, there are also Rayleigh and Love surface waves that travel at lower speeds.
Seismic waves have dominant frequencies of 40Hz, much lower than audible sound.
(1) This is not true in special cases very near the source where the explosion, impact, or earthquake permanently deform or fracture the rock.
(2) For a more general discussion to the elastic equations of motion as used in seismology see Aki and Richards
[Aki, K., and P.G. Richards. Quantitative Seismology: Theory and Methods. W.H. Freeman, 1980]
2.2 THE GOALS OF SEISMOLOGY
EXPLORATION SEISMOLOGY. Exploration seismology uses a controlled source such as a hammer or small explosive charge, and records reflections and refractions from the rock layers a few feet to several miles below the surface. (Signals recorded for exploration seismology are short and have a limited dynamic range and bandwidth compared to most sounds. They are more like a recording of a hand clap or gunshot made in a canyon… the source impulse is short and the interesting portion of the recording is the echo.)
PLANETARY SEISMOLOGY. Planetary seismology uses recordings of volcanic eruptions, large explosions, and earthquakes. (Signals recorded for planetary seismology are continuous)
4.3 FREE OSCILLATION DATA
One interesting application of audio data is for free oscillation data. The earth rings when struck, like any solid object such as a bell. The characteristics of the oscillations depend on where and how the earthquake occurred, the material properties of the surrounding rock, and the location of the seismic recorder. It is not yet clear what could be illustrated in an audio display but, in view of the analogs to bell like objects, the possibilities are intriguing.
4.4 DATA DISCOVERY
Data discovery includes the processes of examining seismic waveforms for information of interest and forming the initial hypothesis about the causes of the disturbances. Such hypothesis will be tested and explored further with additional specialised processing and displays. This initial look forms the jumping-off point for imaginative new observations and ideas. By enriching the current displays with audio in a simple direct manner with few processing biases, there is less possibility that interesting information will be overlooked.
…Auditory displays summarise the information in a different manner than common plots, allowing a second chance to recognise relationships in the seismic data.
4.7 EDUCATION
Education is potentially a very rewarding application. The explanation of how seismic energy travels through the earth can be enhanced with examples and explanations that draw on everyday listening experience, such as echoes or the sounds that objects make when hit. The intuitive grasp of physical acoustics that we accumulate in our life can be carried over to certain aspects of seismology.
4.8. MODEL WATCHING
Much of seismology is devoted to determining reasonable earth structures. Once an initial hypothesis is formed, numerical models are developed to test and further improve the hypothesis. Various methods of 'fitting' data to models are available, but it is often appropriate to build a guided model based on interactive input. The model is iterated and displayed versus the real data while the user makes certain adjustments to model parameters. Model and real data may be summarised with a goodness of fit, but may also be displayed overlaid. It is natural in such a case to also display the audification in side-by-side comparisons.
5. PROBLEMS IN AUDIFYING SEISMOGRAMS
Ideally, processing techniques should preserve the physics of the input data while making all interesting features audible. This is required if the final display is to take advantage of our native ability and experience in interpreting natural sound. To be audible the sound must fit within human frequency and amplitudes limits for comfortable listening.
* The information is nearly subsonic
Some recorded data includes audio frequencies, but the dominant energy for most reflections is centred near 30 Hz where it is difficult to distinguish small changes in pitch and timbre.
* The bandwidth is narrow compared to natural sounds.
Seismologists go to great lengths to record broadband signals. Good definition over three octaves is considered excellent. This is far short of the ten-octave range of natural sounds.
* Both the direct wave and reflected signals are short compared to natural speech and most environmental sounds. Most reflection recording is less than 3 seconds with much of the interest in the first second or two.
* Classical seismic interpretation (where each waveform peak is interpreted) is nearly impossible in a straight edification. In reflection seismic interpretation, coherent peaks on adjacent traces are interpreted as reflections of a rock layer. The times of these peaks and the interval to the next set of peaks are careful measured and mapped. This measurement of each wiggle may be more amenable to signification or visual display.
* The dynamic range of some signals is extremely large (>100dB) over a relatively short period. This problem has to be handled by graphical dispelys too. One method used for plots is to clip waveforms when they exceed a particular amplitude.
* The signals are nearly all far infrasonic. Typical teleseisms (distant signals) have their dominant energy below 1 Hz and only the closest earthquakes and blasts have energy above 10Hz.
* Earthquake signals span more than 17 octaves. This presents problems not only for auditory displays, but for almost any other form of raw data display. Researchers have found it difficult to record or deal with displays that include more than a few octaves of signal.
* The dataset size can be huge. Because stations record continuously for years, the dataset size grows. If instrumentation has not changed, selected waveforms from many years of recording may be appropriate to a particular interpretation problem. Indexing, retrieving, and displaying these selected segments is a problem in itself.
* The dynamic range of interesting earthquake signals is large.
Today, 24-bit recording systems with a dynamic range > 140 dB are common. Fortunately, in many cases 16 bits will adequately represent the waveform.
6. PROCESSING TECHNIQUES
6.1 PREPROCESSING
Preprocessing consists of adapting the raw seismic field data into a form that can be output to an audio interface. Most dat requires a simple amplitude rescaling and DC removal to adjust the range of the recorded data to the range of the output D-to-A converters. Usually high-quality interpolation is also needed to produce an acceptable sample rate without distorting the input waveform.
DC bias
http://en.wikipedia.org/wiki/DC_bias (mean value of the waveform)
Interpolation
http://en.wikipedia.org/wiki/Interpolation
6.2 TIME-COMPRESSION
Some shallow exploration reflection data has enough high frequency to be audible if played at recorded speed. Most earthquake records are not directly audible since the significant energy is all below 10 Hz. To be heard the seismograms must be processed to move the dominant energy into the audible bands. This process must preserve any of the relations to acoustic physics. For example, a low pianolike sound must remain pianolike when shifted in frequency. It must preserve the characteristic attack and decay of impulsive sounds as well as harmonic relationships. Two tones separated by an octave must maintain an octave separation shifted up in frequency.
Time-compression is playing data faster than it was recorded. It is a simple direct method of making low frequencies audible and it preserves the physics (the result still follows the wave equation). A data stream recorded at 40 samples/second and played at 8000 samples/second has a 200-times compression. This allows 3 hours of recording to be played back in less than a minute, comparable to the amount of time to quickly study 3 hours of plotted data.
6.3 AUTOMATIC GAIN CONTROL (AGC)
Some type of amplitude scaling has to be done to bring the signals in the range of the D-to-A. Many seismic signals have a dynamic range in excess of comfortable listening levels, so signals may be processed through an AGC prior to playback. AGC increases the volume during quiet periods and decreases it for large signals analogus to automatic level controls on recording equipment.
Window lengths are typically 200 samples or about 1/40 second for most traces.
It was also necessary to preprocess traces with AGC before doing frequency doubling.
Automatic Gain Control
http://en.wikipedia.org/wiki/Automatic_gain_control
6.4 FREQUENCY DOUBLING
While time-compressing data does move events from the subaudible to the audible, it brings with it another set of problems. Signals from some earthquakes may only last a minute on the original recording. Speeding up the recording by 200 times will result in a sound that only lasts a fraction of a second, so short that it is difficult to study. It may be recognisable as a single sound but it cannot be taken apart into its components.
Some early experimenters avoided the problem by using the minimum compression to make the seismogram audible. The resultant sounds were dominated by very low frequencies. Others shifted the frequencies into the audio range by multiplying the signal by a carrier to produce an FM signal. Unfortunately, this is an additive shift in frequencies. Thus, if 20 Hz is shifted to 440 Hz, then 40 Hz will be shifted to 480 Hz. This does not preserve the harmonic relationships. It also produces a section that is narrower bandwidth than the original (in terms of octaves) and a sound that is quickly fatiguing.
Close study requires a way to slow the playback without changing the pitch and the harmonic relationships. The operation of frequency doubling shifts any pure tone up one octave. The audio track may then be played at half speed to get the original pitch in a signal with twice the duration.
One problem with frequency doubling is that it accentuates the dominant energy and suppresses more subtle arrivals. Informal experiments indicated that it improves the display if digital automatic gain control is applied prior to frequency doubling.
Frequency Modulation
http://en.wikipedia.org/wiki/Frequency_modulation
6.5 ANNOTATION AND MARKERS
Undamped bell tones were used in the initial experiments. They were replaced with dreamlike sounds generated by passing an impulse through a narrow bandwidth, first order Butterworth filter.
Butterworth Filter
http://en.wikipedia.org/wiki/Butterworth_filter
6.6 LOOPING
For some recordings, using an equaliser to boost or cut different frequency ranges while the loop is playing will help extract particular sounds.
8. CONCLUSIONS
Annotation is particularly important. Good annotation allows the listener to match events on a graphic display with a correlated audio. In multiple annotations, tones must be separated from each other by slight frequency differences or positions in stereo. Annotation tones must be similar to the signal or the listener will perceive two unrelated streams and it will be difficult to relate the timing between the two.
9. FUTURE EXPERIMENTS
The use of audio suggests new possibilities for seismic attribute displays in exploration data, including direct hydrocarbon indicator displays of various types, audio attribute displays, and amplitude vs. offset displays. Of particular interest are displays for modelling and quick look, when the audio tag may indicate whether the visual display is useful.
The audio seismogram is still in its infancy. The tools to produce it are currently cumbersome and not part of the daily tool set available to seismic analysts. The real proof of the utility of the tool will come only when auditory display is a natural part of seismic analysis. This will require making audio tools accessible to working seismologists in a natural well-designed interface.
NOTABLE REFERENCES
1. Aki, K., and P.G. Richards. Quantitative Seismology: Theory and Methods. W.H. Freeman, 1980.
3. Bullen, K. E., and Bruce A. Bolt. An Introduction to the Theory of Seismology, 4th ed. Cambridge: Press Syndicate of the University of Cambridge, 1985.
5. Frantti, G. E., and L. A. Leverault. "Auditory Discrimination of Seismic Signals from Earthquakes and Explosions." Bull. Seismol. Soc Am. 55(1) (1965): 1-26.
8. Speeth, Sheridan Dauster. "Seismonitor Sounds." J. Acous. Soc. Am. 33(7) (1961): 909-916.
- Genre
- Experimental